We’ve already covered why studying with official practice questions is the best way to prepare for the GMAT. But even if you come up with the correct answer to an official problem, you still might not understand the underlying principles used to create that particular question, leaving yourself open to traps and pitfalls set by the test writers. In the explanations below, I will use some of the core tenets of the Menlo Coaching GMAT curriculum to breakdown two official GMAT Data Insights practice questions and provide important principles for correctly attacking this question type in the future.
Data Insights is the most recent addition to the GMAT, debuting with the Focus Edition. The section includes “Data Sufficiency, Multi-Source Reasoning, Graphics Interpretation, Table Analysis, and Two-Part Analysis.” In the two sample problems below, we take a look at Graphics Interpretation and Table Analysis.

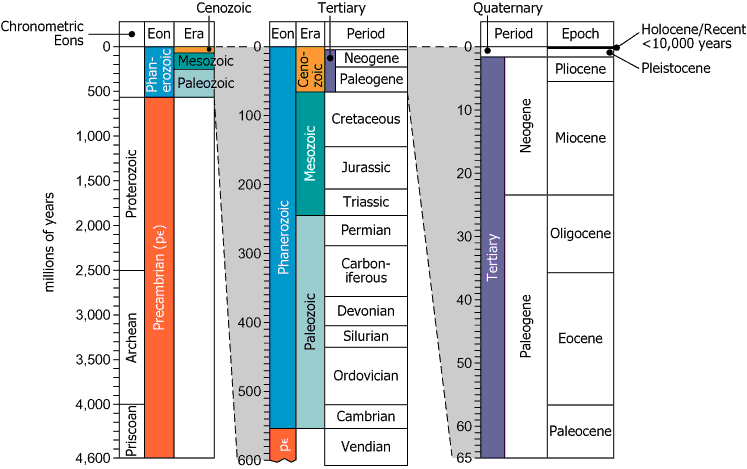
The diagram shows, in three column groupings, various divisions of Earth’s geological history since its formation approximately 4,600 million years ago. In the leftmost column grouping, the Precambrian eon is subdivided into chronometric eons shown on the far left; but otherwise, in the rest of the graphic, each subsequent column to the right shows the subdivisions of the timeframes to its left. Each of the rightmost two column groupings is a magnification—with additional information—of a portion of the grouping directly to its left.
Fill each blank using the drop-down menu to create the most accurate statement on the basis of the information provided.
The Miocene epoch spans closest to of the era of which it is a part.
According to the diagram, the beginning of the marks the onset of a new eon, era, and period in geological history.
| The Miocene epoch spans closest to 25% of the era of which it is a part. |
| According to the diagram, the beginning of the Cambrian period marks the onset of a new eon, era, and period in geological history. |
The table displays data on Brazilian agricultural products in 2009.
| Commodity | Production, world share (%) | |||
|---|---|---|---|---|
| Production, world rank | Exports, world share (%) | Exports, world rank | ||
| Beef | 16 | 2 | 22 | 1 |
| Chickens | 15 | 3 | 38 | 1 |
| Coffee | 40 | 1 | 32 | 1 |
| Corn | 8 | 4 | 10 | 2 |
| Cotton | 5 | 5 | 10 | 4 |
| Orange juice | 56 | 1 | 82 | 1 |
| Pork | 4 | 4 | 12 | 4 |
| Soybeans | 27 | 2 | 40 | 2 |
| Sugar | 21 | 1 | 44 | 1 |
For each of the following statements, select Yes if the statement can be shown to be true based on the information in the table. Otherwise select No.
|
No individual country produces more than one-fourth of the world’s sugar. |
||
|
There are countries that export a greater percent of their coffee crops than does Brazil. |
||
|
Of the commodities in the table for which Brazil ranks first in world exports, Brazil produces more than 20% of the world’s supply. |
||
|
If Brazil produces more than 20% of the world’s supply of a commodity, it must be the world’s top exporter of that commodity. |
| Yes | No | No individual country produces more than one-fourth of the world’s sugar. |
| Yes | No | There are countries that export a greater percent of their coffee crops than does Brazil. |
| Yes | No | Of the commodities in the table for which Brazil ranks first in world exports, Brazil produces more than 20% of the world’s supply. |
| Yes | No | If Brazil produces more than 20% of the world’s supply of a commodity, it must be the world’s top exporter of that commodity. |
The task involves determining true statements based on table data. The goal is to discern absolute truths from potential falsehoods. Similar to critical reasoning exercises, we aim to distinguish what must be true from what could be false.
To succeed on GMAT Data Insights questions, precision in interpreting specific data subsets, careful consideration of contextual details, and an ability to discern crucial information from overwhelming datasets are key. As you can see with the other sample questions, you must learn how GMAT data insights questions are made difficult and what mindsets and strategies allow you to overcome this difficulty. Keep this in mind as you pursue your GMAT prep, no matter what form that prep takes.
Menlo Coaching offers a comprehensive GMAT prep course focussed on cracking the code behind the question types and enabling you to reach your desired score.
Need even more data insights help? Read our guest post on Poets&Quants to learn why, on GMAT data insights problems, you should find the “reward” in your answer!

Replies in 24 hours
✓ Get feedback on your profile as a test-taker
✓ Ask questions about strategy, timelines, or the GMAT itself
✓ Learn what you need to work on to improve your score
✓ Find out whether you’d be a fit with live classes or private tutoring